What is the developer console for?
Even the most experienced programmers make coding errors from time to time because, let’s be honest, we’re all human beings. By default, errors are not visible in the browser. This means that if something suddenly goes wrong, you will not see what’s broken and, therefore, will not be able to fix it.
For solving such troubles, so-called Developer Tools were built into browsers. Thanks to this feature, Google Chrome and Firefox stole the hearts of the vast majority of programmers. Of course, other browsers also have similar features, but frankly speaking, they significantly lag behind in terms of functionality. In general, almost all programmers have their own favorite browser, while other browsers are used only to catch and fix specific “browser-dependent” errors.
We need Developer Tools for hacking messengers like Telegram and WhatsApp. Read how to hack WhatsApp “Last Seen” feature here.
Now it’s time to dig deeper and learn the basics of hacking and espionage. To do this, we will analyze and see how to work with such a powerful tool as Developer Tools in detail.
How to open the developer console window in Google Chrome?
At this point, we will learn how to work with the console on the example of a site error.
Open the following webpage.
There is a javascript error hidden on this page. An average user cannot see it, but we can easily detect an error using Developer Tools.
Press F12 if you are using Windows, or Cmd + Opt + J if you are using macOS.
By default, the Console tab will open in Developer Tools. It looks something like this:

The appearance of this window may vary depending on the version of the Chrome you are using, that is, some details may change, but in general, the appearance remains similar to previous versions.
In the console, we can see the error message highlighted in red. In this case, the script contains an unexpected identifier. On the right, there’s a link to the source code data:text/html;base…10 with the line number of the code where the error was detected. Under the red line, a.k.a. the error message, you may have noticed a blue symbol “>”. It denotes the command line, where we edit and run the javascript of the command. To run it, you need to press Enter.
Multi-line input
Usually, when you press Enter, the entered line of code is executed right away. To move the line, press Shift + Enter. This way, you can enter a longer JS-code.
On the example of error detection, we figured out how the developer console woks.
How to open the developer console window in Firefox, Edge, and other browsers?
In most browsers, Developer Tools can be opened by pressing F12. Their appearance and operating principles are not much different. Having dealt with the tools in Chrome, you can easily work with them in another browser.
How to open the developer console window in Safari?
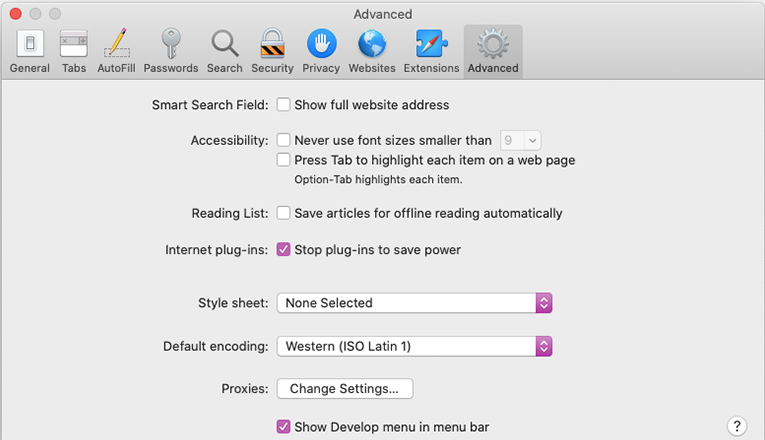
Safari, a browser developed by Apple that is not supported by Windows or Linux, is the only browser that has a slight difference, and we will now take a look at it. To get started, we need to go to the Develop menu. Pull down the Safari menu, choose Preferences, click on the Advanced tab, and check the box next to Show Develop menu in the menu bar.

You can activate the console by pressing Cmd + Opt + C. Also, pay attention to the Develop menu tool. It contains a large number of commands and settings.
Let’s sum up:
- Developer tools are used for identifying errors, executing commands, checking the value of variables, and a lot more useful stuff. For instance, for hacking messengers.
- In most browsers running on Windows, you can open Developer tools by pressing F12. If you use Chrome on macOS, use the combination Cmd + Opt + J. If you use Safari, press Cmd + Opt + C (you need to first enable the Developer menu).
Now, you’ve mastered our main weapon, the developer’s console, so you can easily do this with your eyes closed:

Or you can even recover deleted messages in Telegram. We will tell you how to do this in the following articles.


